How to test ro membrane?
How to Test an RO Membrane
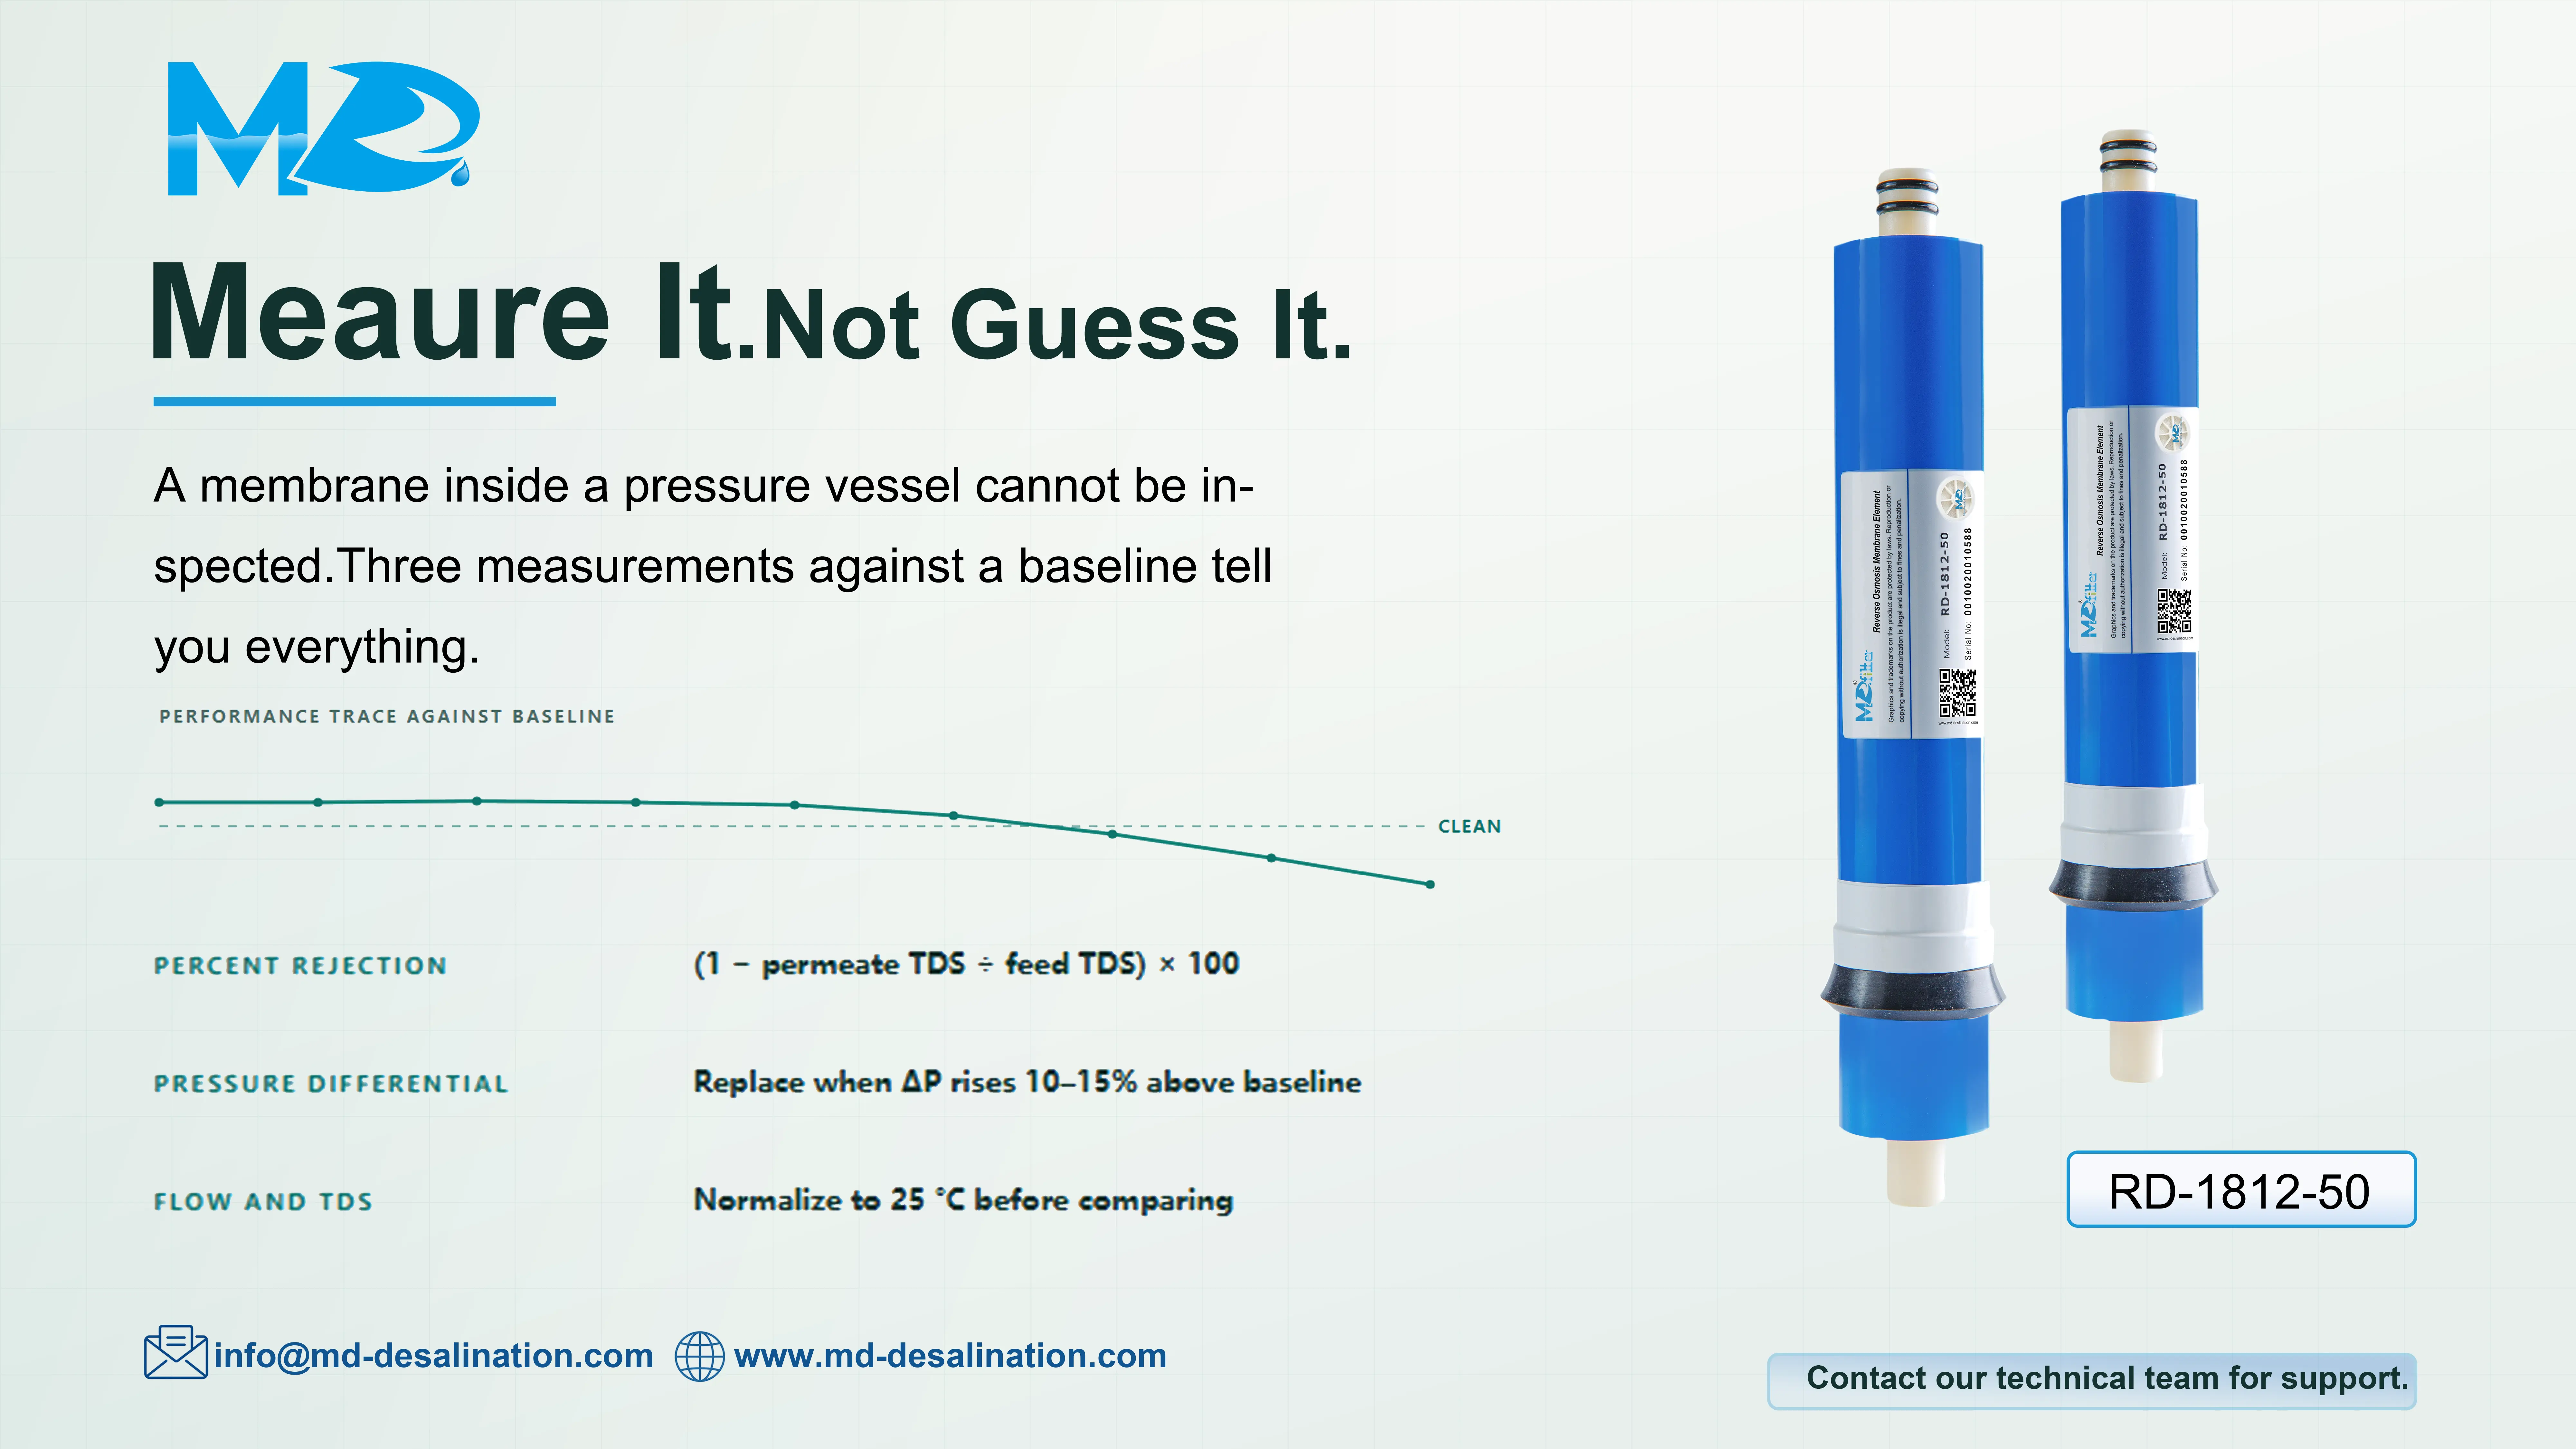
An RO membrane's performance cannot be judged by looking at it. It sits inside a pressure vessel, and the only reliable evidence of its condition comes from measured data compared against a baseline recorded when the element was new. This guide covers the measurements that matter, how to calculate them correctly, and what the results mean.
Calculate Percent Rejection First
This is the single most useful number in RO membrane testing, and it is often skipped.
Percent rejection = (1 − permeate TDS ÷ feed TDS) × 100
A seawater element reading 350 mg/L permeate against 35,000 mg/L feed is rejecting 99.0%. The same element reading 400 mg/L is rejecting 98.9% — a change that looks trivial in the permeate figure but represents a real decline in performance.
Two cautions apply to this calculation:
TDS meters measure conductivity, not TDS. The meter applies a conversion factor, which is an approximation. The value is good enough for trend monitoring, but where a specification has to be verified, use a laboratory analysis or a calibrated conductivity measurement with a known conversion factor.
Feed and permeate TDS both move with temperature. Readings must be taken at comparable conditions, or corrected to a reference temperature — commonly 25 °C — before they are compared. A rejection figure calculated from readings taken at different temperatures is not a valid comparison.
The Measurements That Matter
1. Conductivity and TDS of feed and permeate
Measure both streams, calculate percent rejection, and compare against the baseline. A falling rejection rate is the earliest indication of membrane damage or oxidation, and unlike fouling it is not recoverable by cleaning.
2. Permeate flow rate
Measure permeate flow, normalize it for temperature and net driving pressure, and compare it with the baseline.
A decline in normalized permeate flow indicates fouling, scaling or compaction. Note the word normalized: raw flow readings fall in cold water, so an operator who compares raw numbers through the seasons will see problems that do not exist — and miss ones that do.
3. Pressure differential
Record the pressure difference between the feed and the concentrate. An increase of 10–15% above baseline indicates fouling or scaling in the feed channels.
This is one of the most useful and least expensive measurements available, because it moves before permeate quality does.
4. Feed water conditions
Record feed temperature, pH, conductivity and SDI alongside the membrane data. Membrane performance cannot be interpreted without them — a change in rejection that coincides with a change in feed temperature or pH is usually explained by the feed, not by the membrane.
5. Water quality of the permeate
For drinking water applications, test the permeate for the parameters your regulatory framework requires, plus microbial indicators. This confirms that the membrane is producing water fit for its intended use, which is a different question from whether the membrane is performing to specification. Both matter for different reasons.
6. Records
Performance trending is only possible against a baseline. Record the following when the element is commissioned, and record them again after every cleaning:
Feed TDS, temperature, pH and pressure
Permeate TDS and flow
Concentrate pressure and flow
Percent rejection and normalized flow
An element with no baseline cannot be diagnosed. This is the most common reason a performance complaint cannot be resolved.
On Visual Inspection
Visual inspection is useful, but only in a specific and limited way.
A membrane element installed inside a pressure vessel cannot be seen. What can be inspected visually are the accessible components: the permeate tubing, O-rings and interconnectors, the end caps, and the concentrate and permeate lines. Leaks or damaged O-rings in these locations cause a loss of rejection that looks exactly like a failing membrane, and they are far cheaper to fix.
Inspecting the membrane itself requires removing the element — and once removed, the correct procedure is to autopsy a sacrificed element: cut it open, examine the foulant layer, and analyze it. This is a deliberate diagnostic step, not a routine check.
What the Numbers Mean
| Observation | Likely cause | Action |
|---|---|---|
| Falling rejection, stable flow | Oxidation, O-ring leak, feed seal bypass | Inspect seals first; if they are sound, the element has degraded |
| Falling normalized flow, rising ΔP | Fouling or scaling | Clean, then re-measure |
| Falling normalized flow, stable ΔP | Compaction, or low feed temperature | Compare against temperature-corrected baseline |
| Rising permeate TDS at constant conditions | Species passage increasing | Check feed pH and chlorine control |
| Sudden change in all parameters | Instrument fault or process upset | Verify the instruments before acting on the data |
The last row is worth taking seriously. A sensor that has drifted produces the same signature as a membrane that has failed, and acting on bad data is expensive in both directions.
FAQ
Q: What is the ideal TDS level for RO-treated water?
A: There is no single ideal figure, and it is worth separating health guidance from palatability.
For reference, single-pass seawater RO typically produces 200–500 mg/L, and domestic RO systems commonly produce well under 100 mg/L. Where water is very low in TDS, the recognized concern relates to mineral content rather than TDS itself: demineralized water supplies little calcium and magnesium, and the WHO has noted that water with very low mineral content may be associated with adverse health effects where the diet does not compensate.
Q: What are common signs that an RO membrane needs replacing?
A: A decline in percent rejection that cleaning does not restore, normalized permeate flow that stays low after correct cleaning, or physical damage found when the element is removed. Taste and odor changes are worth investigating, but they indicate that something has changed in the water — they do not identify the membrane as the cause.
Q: How often should an RO membrane be tested?
A: Continuous monitoring of permeate TDS and flow is preferable to periodic testing, and pressure differential should be logged at the same time. Where continuous instrumentation is not available, measure monthly at minimum, and after every cleaning or process change.
Q: Can I test a membrane without removing it from the pressure vessel?
A: Yes — and that is the normal case. Rejection, normalized permeate flow and pressure differential are all measured from outside the vessel, using the permeate and concentrate lines. Removal is only required for physical inspection, and then the correct approach is to autopsy a sacrificed element rather than reinstall an element that has been opened.
Conclusion
Testing an RO membrane is a matter of measuring three things correctly — percent rejection, normalized permeate flow and pressure differential — and comparing them against a baseline. Water quality testing then confirms that the permeate is fit for its intended use, which is a separate question.
The measurements are simple. What makes them useful is consistency: same units, same temperature correction, and a baseline recorded at commissioning. Most unresolved membrane performance complaints trace back to a missing baseline rather than a failed element.
MD Desalination is a manufacturer and supplier of RO membrane elements, offering OEM and ODM services for domestic, commercial, industrial and seawater applications. We maintain large inventory, hold complete product certifications, support sample testing, and ship with strict packaging controls. To discuss your membrane requirements, contact us at info@md-desalination.com.